At work we have a datacenter, so we have things that require monitoring like generators, air handlers (industrial aircon to keep the servers cool), and uninterruptible power supplies. Our building monitoring system was originally written by a colleague that has long since left and the responsibility of maintaining it has fallen to me. The monitoring works fairly well, with a few issues that I had to resolve which I will talk about here. The main issue I encountered was that the generators would occasionally stop responding to queries, they would also not notify properly if they were running. Thankfully they are loud enough to hear in the office if they are running, so there is no worry about us not noticing. We have also never had a time we have had to run on generators that wasn't a power drop test since the datacenter was built (touch wood!). They are also checked at the start of each shifts walkaround to ensure they are in the correct mode/no warning lights showing.
There wasn't much documentation left on how the modbus stuff works for talking to them, so I had to work it all out. First I started by reading the wikipedia page for modbus, so I could get an idea of what it actually is. To save you a click, if you are lazy; it's a serial communications protocol for programmable logic controllers. Though we actually talk to the generators over TCP, not serial. I also managed to find a PDF online for the registers for the control panel.
We are using modpoll as a master for polling the clients (generators), so my next task was to figure out how you get the register address number needed to send to the generator so it could reply with another number that was either the actual value of thing you queried (like fuel level or battery voltage), or a status code (for things like alarms/control state). It turns out that it requires maths, I guess that does make sense since it's for logic boards.. What you have to do is get the "page number" from the list of register tables (which is the more the table number than anything), then times it by 256 and add the register offset from the table.
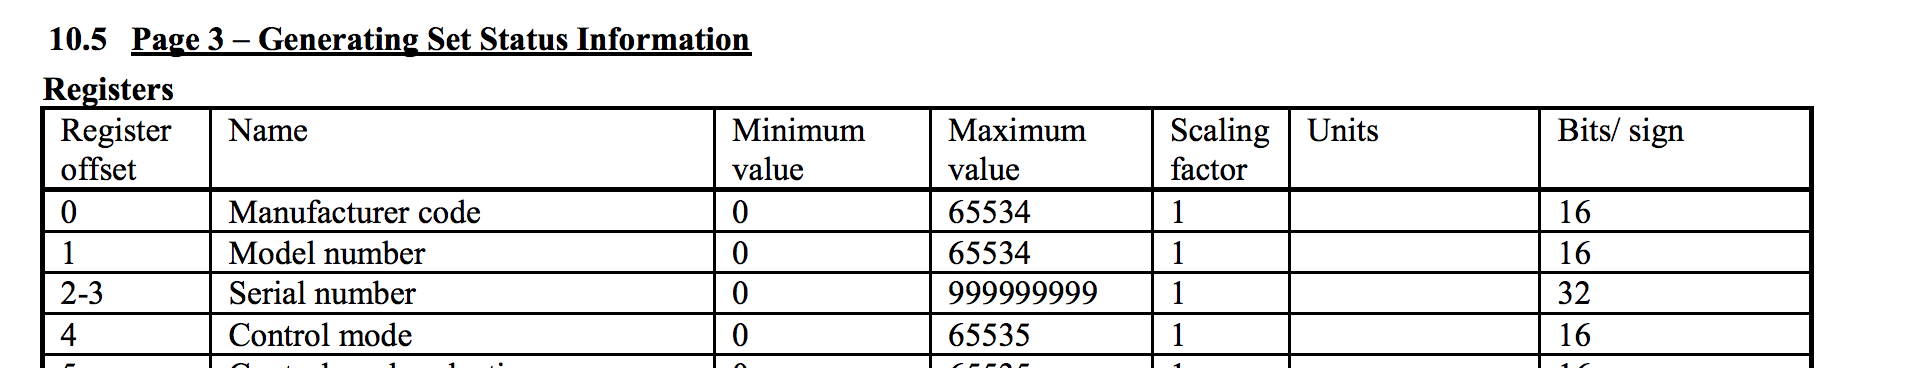
So to find the control mode register address using the registers above we do the following:
(3 x 256) + 4 = 772
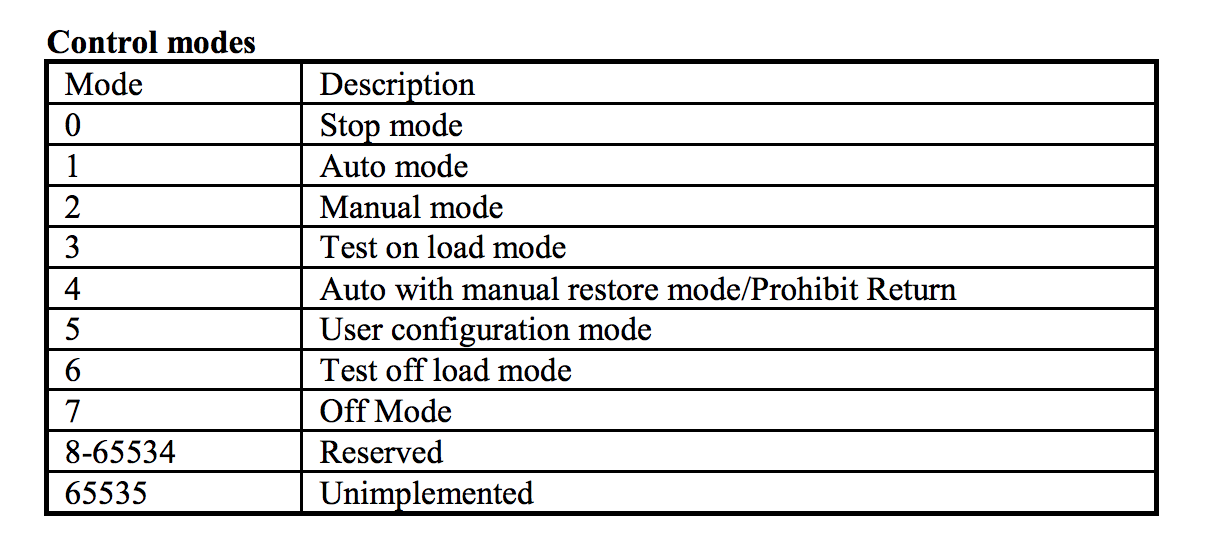
Then when polled it will return one of the mode numbers below
Fairly easy once you get your head around it.
# modpoll -c 1 -m tcp 192.168.0.2 -1 -0 -r 772
modpoll 3.4 - FieldTalk(tm) Modbus(R) Master Simulator
Copyright (c) 2002-2013 proconX Pty Ltd
Visit http://www.modbusdriver.com for Modbus libraries and tools.

Protocol configuration: MODBUS/TCP
Slave configuration...: address = 1, start reference = 772 (PDU), count = 1
Communication.........: 192.168.0.2, port 502, t/o 1.00 s, poll rate 1000 ms
Data type.............: 16-bit register, output (holding) register table

-- Polling slave...
[772]: 1
Next up was trying to find a register for if the engine was running. I did find one for engine status, but even when we started a generator up it would return an invalid mode. I contacted DSE support to query this and they said that since that register is an ECU one, you're not able to query it correctly. What we could do was query for the engine RPM and if it's under a value of something like 600 it's safe to assume that it's not running. This worked really well on the tests we did. I also have to say that DSE technical support is outstanding, considering we haven't paid for anything other than the original panels with the gensets. They replied very promptly to queries, and assisted with troubleshooting issues without complaints!
Next up was the issue with the generators deciding not to talk back to us after a while. The original monitoring scripts were set to query each generator for about 15 different registers every minute, they also did one poll per register. So my guess is that the poor little control panels were effectively being denial of serviced with 15 individual queries to handle every minute. The procedure to reboot the panel so it will talk again is fairly involved as well, you have to open up the control box the panel lives in and unscrew the terminal block screw allowing you to remove the 12v positive wire to the control board, then waiting a few seconds and putting it back in/tightening up the screw. I also worked out that with modpoll you can query a register range, so if you are querying the same registers page you can pull out a number of queries at the same time. This meant that we could cut the 15 queries down to 3; for control mode, engine status, and alarms. We also only really need to check if the engines are running every minute, everything else can be checked every 10 minutes.
# modpoll -c 6 -m tcp 192.168.0.2 -1 -0 -r 48897
modpoll 3.4 - FieldTalk(tm) Modbus(R) Master Simulator
Copyright (c) 2002-2013 proconX Pty Ltd
Visit http://www.modbusdriver.com for Modbus libraries and tools.

Protocol configuration: MODBUS/TCP
Slave configuration...: address = 1, start reference = 48897 (PDU), count = 6
Communication.........: 192.168.0.2, port 502, t/o 1.00 s, poll rate 1000 ms
Data type.............: 16-bit register, output (holding) register table

-- Polling slave...
[48897]: 0
[48898]: 0
[48899]: 0
[48900]: 0
[48901]: 0
[48902]: 0
The scripts themselves were written in PHP which is good as that's my jam. So I was able to easily update how they worked to incorporate the new changes. The main changes were the splitting of the queries for different timed crons, creating a modpoll function to handle it returning more than one value, and to update the existing queries to use the new functions output.
function modpoll_dse($ip,$register_start,$count) {

    $output = shell_exec("modpoll -c " . $count . " -m tcp " . $ip . " -1 -0 -r " . $register_start);

    preg_match_all('/\[[0-9]+\].*/', $output, $matches);

    foreach ($matches[0] as $output) {

        $output = explode(':', $output);
        preg_match_all('/\d+/', trim($output[0]),$register);
        $register = $register[0][0];

        $value = trim($output[1]);

        $register_values[$register] = $value;

    }

    return $register_values;

}
Then using the same values as the modpoll example above;
$modpoll_dse = modpoll_dse($ip,'48897','6');Array
(
[48897] => 0
[48898] => 0
[48899] => 0
[48900] => 0
[48901] => 0
[48902] => 0
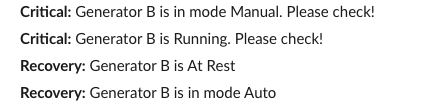
)The output is stored in a database, which used to get sent to nagios via a passive check but I changed this to push to a dashboard we could put up on a big TV in the office that updates every minute. That way people can see if there is an issue with a simple glance at it for colour changes. The dashboard is using the smashing framework. It's really cool, you can just curl your data to the endpoint you create and it updates. I modified the health widget to handle our alerts, if something goes over a threshold, or a status changes the box for that unit goes red otherwise it's green. There is one health widget for each of the units that is monitored, and a separate update script sets the colours based on what text is pushed to the dashboard. Critical (red) alerts/recoveries are also pushed to a slack channel for the infra team on shift, as well as direct messages for the datacenter manager/escalation points.
Since changing the query timing the generators have behaved themselves and haven't stopped talking to us, the slack notifications have also worked very well for letting people know what's going on.